Techniques

Canvasses on Steroids

A popular technique for quickly understanding or planning a business is the Business Model Canvas, introduced by Alexander Osterwalder and Yves Pigneur. This provides a high level ontology in the form of a one page diagram with boxes for key elements of a business.

The canvas idea has also been used for assessing other things including Business Value Proposition; Blue Ocean Strategy Ideas and Product and Service Innovations. There are a number of advantages to the canvas:

  • It is quick and easy to use

  • It is accessible to non-technical executives, managers and domain experts without modelling knowledge

  • It is concise and low effort

  • If well designed, it focusses attention on key concepts (provides ontology)

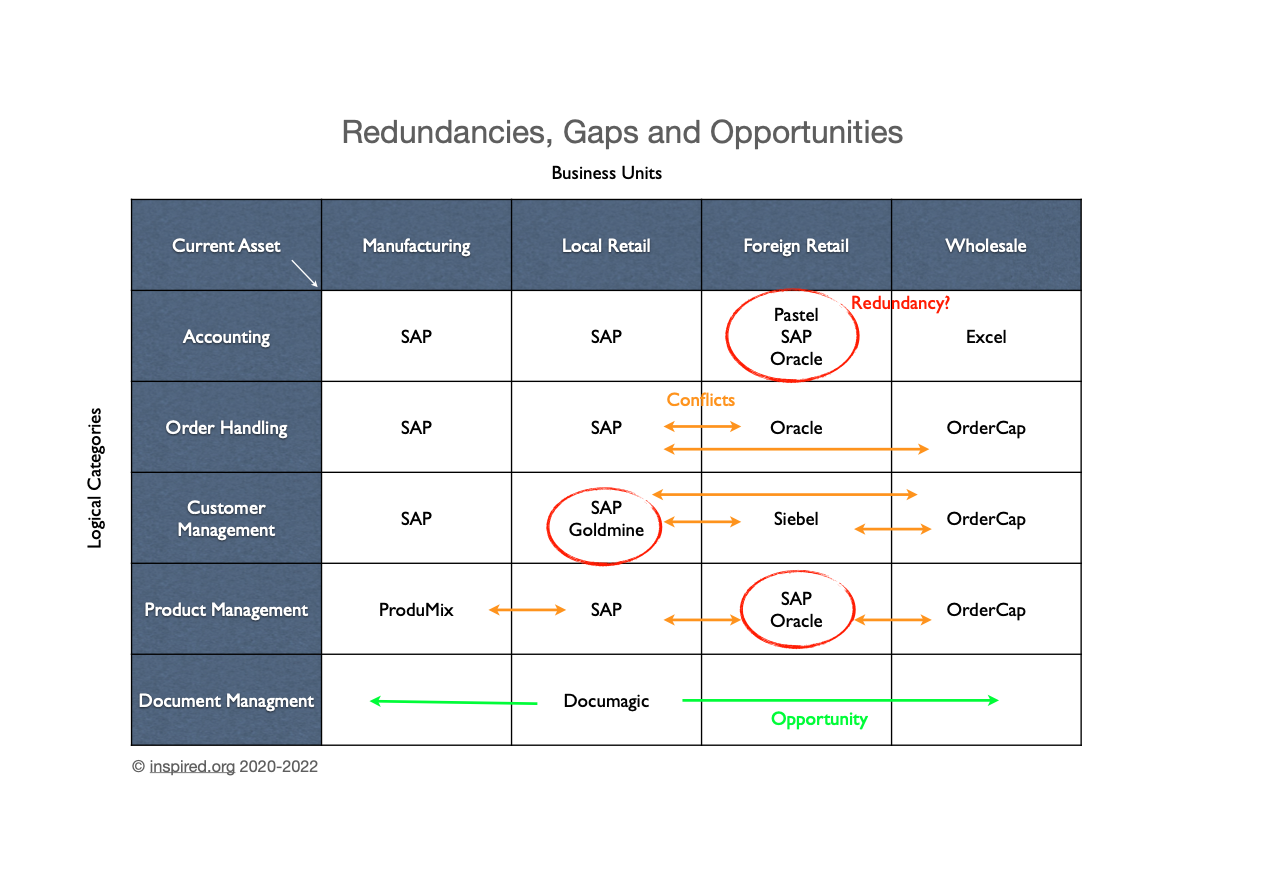
  • It can be done for baseline and proposed scenarios and comparison

However, there are also drawbacks and limitations:

  • It is often just a diagram with little formality of definition behind the concepts or consensus on what each category actually means
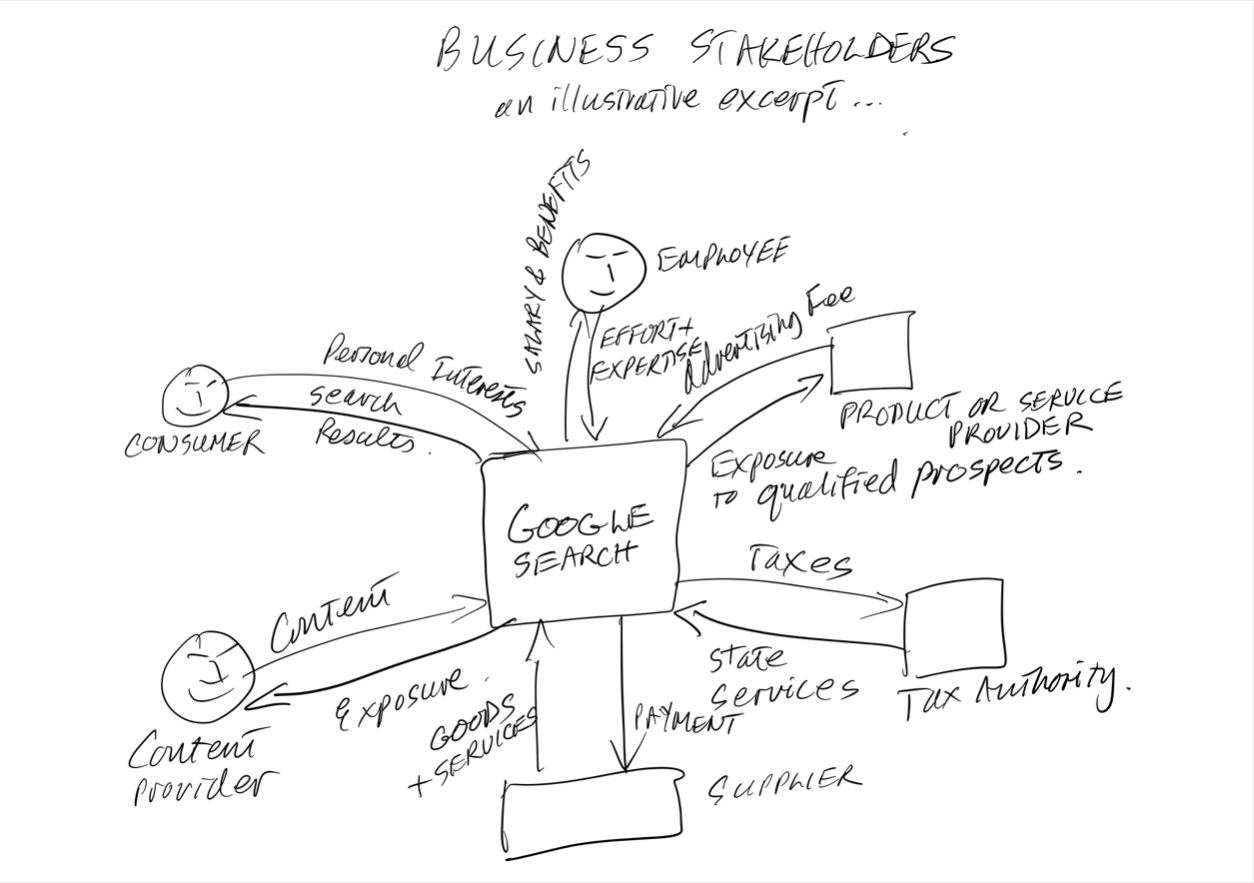
    (Resources may include People, Skill, I.P., Cash, Plant… )

  • Users often mix concepts and instances in completing the blocks
    (Retail Customers, Govt. Dept of Energy…)

  • There is insufficient detail behind the entries to perform more detailed analysis
    (For Revenue Streams we may list Hardware Sales, Software Sales and Services, but we don’t know that these contribute in the proportion 60%, 35%, 5%)

  • Relationships and dependencies are not apparent
    (Which Partners or Resources or Activities are necessary to offer a particular Value Proposition?)

To solve these issues, facilitate richer analysis and integrate the elements in the canvas with other enterprise models and architecture elements, we implemented advanced features for canvasses in our Enterprise Value Architect (EVA) tool platform:

  • Users can define canvasses using any concepts defined in the meta model (also user definable). Concepts are represented by user friendly names and icons

  • Users can choose the canvas layout, size of boxes etc.

  • Items captured into a cell can include hierarchies, thereby facilitating use of subcategories and templates, if desired

  • Items captured are repository objects with relationships and any desired properties, which can include rich items such as documents, images, calculations etc. Items in the canvas have hyperlinks to view or edit these details

  • Items can be related in the canvas by drag and drop. Related objects are highlighted when the cursor is hovered over an item

  • Items can be included in any other tool view, including reports, generated documents, matrices and graphical models

  • Canvas views can be linked into menus for easy access by users collaborating on a shared repository. Since the tool is web based, these users can be anywhere

These innovations make canvasses very powerful! Take a look at the demonstration below.

Architecture as a Context for Agility

Agility requires doing focussed things rapidly. The more you know going in, the better decisions you can make quickly. The more you document what you learn, the more knowledge is available for future efforts. Good agile work fills in more of the picture thereby enabling all teams.

The more of the picture is filled in the more we can avoid wasted effort, align our efforts and deliver with less risk. You can’t create the full picture quickly, which is why many agilists avoid architecture.
But you can start with a “paint by numbers” reference model/ontology, which gives you the framework into which to rapidly record your growing knowledge and which indexes where to look for information for your next effort, and what touches the squares you want to colour, so you know how to be informed and compatible.

Every project (agile or otherwise) should:

  • Be informed by our knowledge of current architecture assets and challenges

  • Contribute to an improvement in assets, condition, effectiveness and future readiness

  • Improve the architecture of the portfolio

  • Deliver business value

  • Fill in more of the architecture “big picture” to inform future projects

The environment should:

  • Have a conherent integrative meta model/shared concepts

  • Encourage good work through well conceived principles

  • Have standards for how things get recorded (artefacts) so they are meaningful and sharable

  • Provide a collaborative repository that holds things and makes them findable

#agile #project #architecture #context

Application Portfolio - Deriving Value from the Asset

The application portfolio in mature organisations represents a very significant investment over an extended period. Expenditure can easily run into hundreds of millions or even billions. This can be a major asset to leverage to produce value, or a major problem that consumes resources and funds.

Managers, architects and analysts often don’t know where to begin or where to focus to improve value delivered and the contribution of the portfolio to strategic goals. Two things that can help are Taxonomy and a Landscape Health Assessment.

Taxonomy is a common architecture technique where we use a set of categories (usually capability or functional) to organise the baseline applications so that we can detect redundancy (multiple things doing the same job), gaps (where we do not have something or the current solution is not adequate) and opportunities (where there is something useful but it is not widely deployed; or there is an easy “off the shelf” solution for a gap). A good starting Taxonomy can often be obtained as an industry or domain reference model.

A Maturity Model is less common. In fact, several years ago we were doing a consulting assignment and looked in vain for a “maturity model” or “portfolio review model” for the application landscape. In the end we created one which we have used since. I recently revised this to include guidance based upon findings (as we have for other models including our Data Management Maturity Model) and we have automated it on our Maturity Model Platform, in turn based upon our Enterprise Value Architect tooling.

This provides a quick, guided, automated way to move from little knowledge to a robust view on the application portfolio status; scores on several important health dimensions; and recommendations of actions to improve the health of the portfolio and value delivery to the business. The instrument also looks at strategic issues and leveraging technology. For a limited time, you can try it free. You can save results, retrieve them in future and compare them over time or scenarios.

Take the Application Landscape Assessment

We welcome feedback and further questions.

If you are keen to build Application and Solution Architecture Skills, consider our Techniques and Deliverables of Application and Solution Architecture online live 5 day course (31 Oct - 4 Nov).

You can read the full details or enrol here.

Unifying Motivation

It’s pretty standard to consider Mission, Goals and Objectives when doing a business architecture. Some use functional decomposition to increase the rigour of ensuring that these are aligned. Maybe we draft a Vision - a shared and inspiring description of a desirable future state. But what of the other reasons we do things? From traditional SWOT analysis come the Strengths we want to capitalise on, the Weaknesses we want to eliminate, the Opportunities we want to exploit and the Threats that we should minimise.

Once we start to bring in outside factors, such as threats and opportunities, we may as well get more comprehensive and look at STEEPLED analysis: Social, Technology, Economic, Environmental, Political, Legislative, Ethical and Demographic factors that may influence plans and actions. Social change may involve nuclear versus extended families; urbanisation, unemployment, etc. Environment factors may mean dwindling resources, avoiding pollution, or creating circular business models. Political factors may dictate which products are viable in a given market. Legislation may require compliance, restrict services we can offer, or dictate hiring policies. Ethics may dictate that we change business practices. Demographic changes, such as an ageing and better educated population, may affect product design.

We can add the concept of Drivers (which overlaps with the preceding), looking for factors that require us to change. Examples include: Competition, Cost or other ratios, Technologies important in our industry, Values and Ethos of the business, etc.

If we analyse capabilities (possibly within value chains / networks / streams), and have a clear vision / mission / goals, then we can also do a Gap Analysis of what is missing to get there. Addressing capability gaps generates clear goals and potentially, initiatives to address them.

Another dimension is our Product and Services portfolio. Which ones are profitable? Which ones are where in their lifecycle? Which ones are sustainable? Which fit best with the contextual analysis we have done? What becomes possible with new technologies, design thinking or innovative business models?

Finally, we can also do a Business Health check (a multi-dimensional review taking in many strategic dimensions including: strategy, management, architecture, human resources, assets and liabilities, profitability, cash flow, return on investment, geographic coverage, shareholding, partnerships, channels, information use, risk management, agility, etc. ) or at least a Balanced Scorecard.

All of the above can be integrated into a coherent Motivation Model. This should be constructed to be compliant with our Business and Architecture Principles which guide what we will and will not do and how we will go about achieving it.

Why do we need to change? What does a desirable future look like? What needs to change? How can we go about it?

#Strategy #Motivation #BusinessArchitecture #EnterpriseArchitecture

Satisfied Stakeholders

A stakeholder is someone (person, entity) that has an interest in the outcome of something. An investor in a business is a stakeholder, as are its CEO and its suppliers and its staff members. A sponsor in a project is a stakeholder, as are the people who will use the resulting system and maintain it. Stakeholders have different perspectives, motivations and expectations. Often, we will rely upon stakeholders for things that we want: investment, information, participation, approval, support, resources… So, it is really important to identify stakeholders, keep them engaged and to meet their expectations (within reason and without compromising our own goals).

Another reason to really keep an eye on stakeholders is this: If we are a business, we prosper to the extent that we continue to deliver value to our stakeholders; delivering that value requires capabilities, which in turn rely upon people, processes, systems, data, technology etc. So this guides where we put our focus and what we need to optimise in our business and enterprise architecture.

From a project perspective, our stakeholders are providing inputs (money, information, resources etc.) with the expectation of some desirable change or result (e.g. a new process, product, system etc. ). To produce the outputs that they require, we will need to carry out various tasks, apply skills, resources and effort to produce various artefacts. If we pay attention to what stakeholders need, we can translate that to product models (configurations of deliverables if you like), the tasks required to produce them, and the people, skills, resources and tools needed to perform the tasks. So, stakeholders can lead us directly into good project plans.

A technique we have evolved to rapidly analyse stakeholder interaction is the Stakeholder Net Value Exchange. This puts an enterprise or project in a central “black box”, surrounded by Stakeholder Types (e.g. Customer) & some important independent Stakeholders (e.g. Industry Regulator). We connect the stakeholders to the entity via edges in the direction of Value flow. You can think of these relationships as Stakeholder provides Value to Entity (inbound) or Stakeholder expects Value from Entity (outbound). For a compact diagram, the value can be recorded as text on the arrow. For a richer diagram (where we can start to see commonality etc. and define values more deeply) we put a Value symbol on the flow.

It is really illuminating to see an Enterprise or a Project from this perspective. It is also possible to model more than one collaborating entity this way, e.g. ourselves and a strategic business partner.
More detailed analysis easily ensues: We need to include all the Stakeholder types as concepts in our Domain Model; We can contemplate what Business Events occur with each Stakeholder, what Business Communication results and which Processes support them.

#Stakeholder #projectmanagement #enterprisearchitecture #businessarchitecture

A Contrary View on Capability

1634127157958.jpeg

Capabilities are fashionable. Everyone is modelling them, but not always well… And just what is a capability?

Popular business and EA methods use it more or less interchangeably with a “Business Function”, i.e. something we do. I differ.

Capabilities are often listed below a value chain/network to support the delivery of the value adding steps. This is all well and good. Often stated in simple phrases such as “Attract Talent”, “Create Desirable Products”. In this form they are equal to business functions. Less usefully, they will sometimes be stated as nouns, e.g. “Human Resources” or “Accounting”. These are vague at best and equate more to organisational units or departments.

Other methods include goal, process and service modelling. How do we make sense of all these? Are they competing or complementary?

One technique useful for all of them is decomposition - breaking down higher level goals / concepts / requirements to more detail or more concrete ones.

We can decompose Mission into Goals and Objectives; Mission into Functions; Processes into sub-processes and activities; Services into service components, etc. Can they be integrated? Fortunately, yes! Mission, Goals and Objectives are about what we want to achieve, independent of what needs to be done or how. They can provide a starting point for our decomposition. One mission breaks down into goals (broad directions) which break down into objectives (specific, measurable, achievable, realistic, time bounded). Mission (or objectives) can also be decomposed into functions: what must we do to achieve the goals? Functions should have a verb (doing something), an object (to what?) and qualifying clauses (how, with what constraints).

Functions can be sequenced on dependencies to form end to end business processes. Functions and processes can be packaged as services, with providers (who does it?), consumers (who uses it?), inputs (what is necessary to do it?), outputs (what is expected as a result?) and service levels. We need a catalogue of available services, and a designated way to invoke them.

Ah, but what of capabilities? Well, functions, processes, services can all deliver capabilities. A capability implies the ability to do something (function) for someone/thing (consumer) producing a desired result (service/product) at a particular location, with a certain service level (e.g. volume, efficiency, accuracy, etc. ) and potentially other requirements (e.g. in a particular language). To deliver a capability will typically require resources, such as skill, information, application support, infrastructure and physical presence.

There is nothing wrong with defining business functions (proto-capabilities) at a high level below the value chain. We should ensure, however, that they are expanded into full capabilities during later design to deliver all the dimensions required.

#Capability #EnterpriseModelling #BusinessModelling #EnterpriseArchitecture

All Roads Lead to ROME

1632909089814.jpeg

No, not the historic city. And in fact not all, but few! ROME here stands for Return on Modelling Effort, a term coined by Op 't Land, Proper, Waage, Cloo and Steghuis in Enterprise Architecture - Creating Value by Informed Governance. Springer, 2008.

It is important: organisations spend thousands of hours and millions in revenue building various kinds of models in strategy, finance, enterprise architecture, requirements, solution design and other areas. Often these are useful to their creators, but do not deliver organisational value in excess of their cost.
The problems are often related to appropriateness of models to the kinds of analysis required, accessibility of the models to relevant stakeholders and quality of the models themselves.

Appropriateness relates to the relevant concepts being included, the ability of the models to capture knowledge, share knowledge, support analysis and insights and serve as inputs to further steps. It is also influenced by the appropriate level of abstraction and detail.

Accessibility is related to the representation of the models in ways that are familiar to the relevant stakeholders, ease of sharing and distribution. Architects love complex graphical models, but a business executive might prefer a poster, powerpoint deck or even a story. A financial executive will prefer a spreadsheet or graph. We also need ways to deal with complexity and scale to make them manageable, as well as ways to highlight important insights, rather than overwhelm with volume.

Quality is related to accuracy of gathered information, mapping to the model, fidelity of the modelling techniques and accurate translation to accessible output formats.

Achieving high ROME depends upon a few fundamentals, including: clearly understanding the purpose of the models; identifying and knowing the frame of reference of the Stakeholders in both business and technical domains; choosing appropriate modelling concepts, techniques and representation language that is effective, concise, efficient and precise enough. It also requires sharing outputs (including interim or evolving ones) and engaging various stakeholders positively in the process of model formulation, improvement and evolution.

#ROME #Modelling #EnterpriseArchitecture #BusinessArchitecture #ModellingLanguage

Prepare to Leap - Readiness Tool (How Prepared Are You?)

Image: Isiwal/Wikimedia Commons/CC BY-SA 4.0 / CC BY-SA

Image: Isiwal/Wikimedia Commons/CC BY-SA 4.0 / CC BY-SA

A few weeks ago, I posted an article on how to prepare for emerging from lockdown and preparing to thrive in a Post COVID world. Much has been written and many things have become clearer during the last few weeks. On the other hand, the situation remains fluid with conflicting reports and research emerging daily. We mentioned that we were working on a Readiness Assessment Tool. This is the focus of this article. 

The tool takes the form of a tabular maturity model. See here on details of how maturity models are constructed and how to use and benefit from the insights that they generate. 

This particular one was constructed by us at Inspired, using collective experience and the information available at the time about the pandemic, as well as our background in business architecture, including scenario planning. 

The columns represent maturity levels, as follows:

  • Initial - We are becoming aware of the problem and starting to assess our situation and the impact, but are far from ready

  • Emerging - We have some measures in place, have a reasonable understanding of the problem and its likely impact and a plan of what may need to change

  • Managed - We are executing on the plan, controlling negative impacts and seeking opportunities

  • Optimised - We have everything under control, have delivered on most plan aspects and are monitoring success and adapting where necessary

The rows represent concern areas or competencies. The initial few are shown below. For each of these the cells show typical characteristics of that area for each maturity level. The approach is to examine each row to find where you currently fall (what resonates most with your current state / situation) and then mark that cell before moving on to the next row.

Maturity Model img white blur.png

This will yield a “jagged line” of marked cells down the table representing the current maturity or readiness as assessed. Now comes the magic: Given your current level of readiness on each aspect, there are recommended actions you can take to move up the maturity/readiness scale. For each marked cell we want the set that will help us move up from where we are to the cell to its right. These can be compiled into an action plan and allocated to responsible parties. Obviously, this step will take into account practicalities like costs, resource commitments and relevant benefits.

My colleagues and I have prepared a set of such recommended actions, and integrated them into our Maturity Assessment Tool, which is now available online.

We hope that this instrument can help you on your journey to become better prepared to survive the pandemic and to thrive in the changed world as it abates.

Inspired can assist if you would like to work through a process of examining how it will affect your industry, your organisation and the various dimensions of your business moving forward. One form this can take is a remote/virtual facilitated workshop to understand the New Normal using PESTLE analysis, the readiness instrument, scenario planning techniques and rapid business architecture using tools such as the Business Model Canvas.

An interactive online version of our tool is now available. Generate a maturity report for your organisation quickly and easily.

Get Started


Contact us if you would like to discuss.

Read more on using a maturity model.