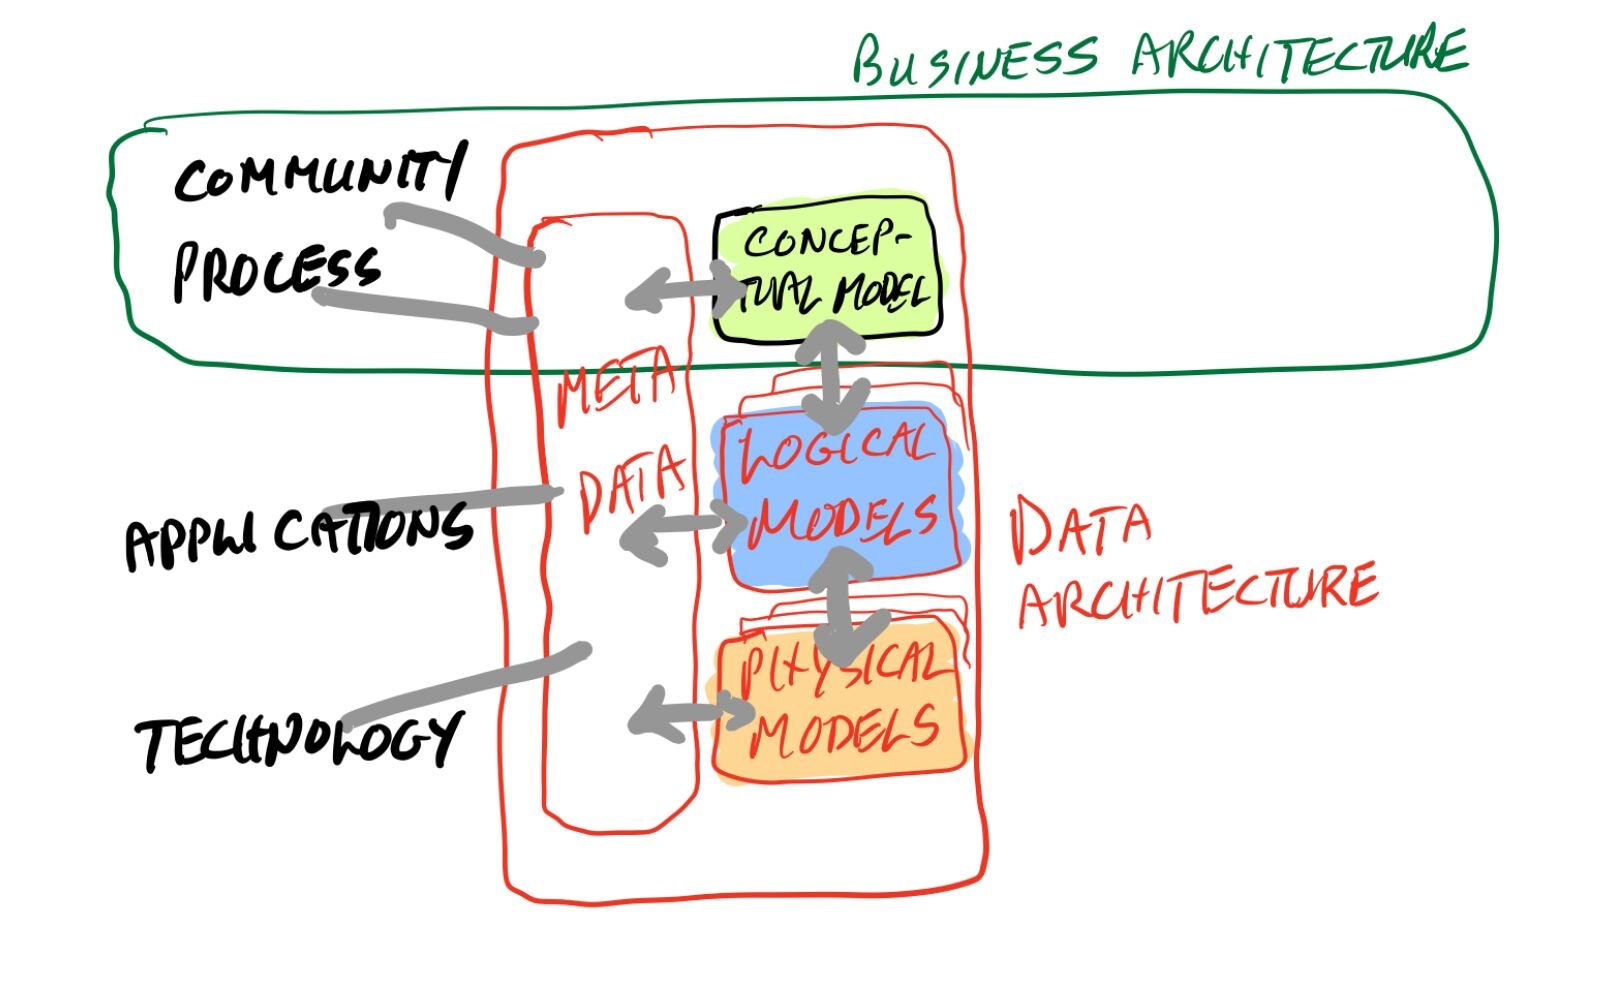

*Information Nutrition Quotient
Ink used to be the medium of communication and transferring knowledge and emotions. Text, diagrams and drawings. Its been largely superseded by digital images and video.
In the age of AI, we see more and more translation of a brief text into a waffly video. AI generated narrative, random vaguely related backgrounds and AI voice. A paragraph becomes a 7 minute video on YouTube. A click bait headline and we get sucked in.
This is all extremely inefficient.
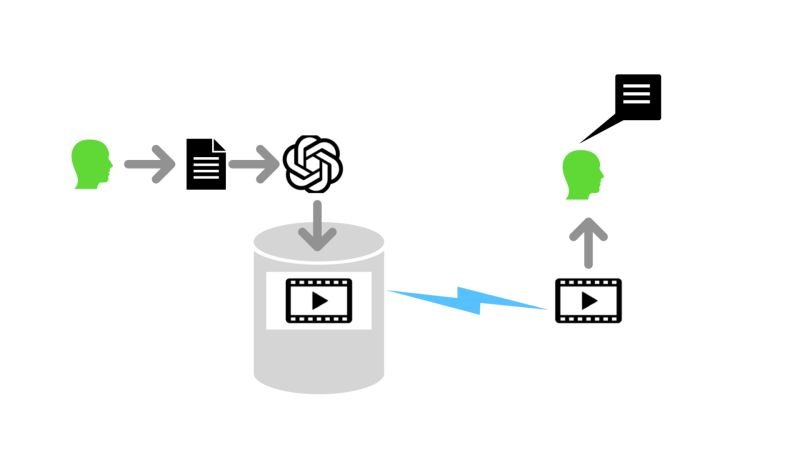
In machine terms:
AI’s to generate the script, backgrounds, video and voice were trained on massive data sets in huge data centres consuming lots of power
AI’s did the generation (once, or multiple times if their driver tweaked things). The text inflated from a kilobyte or so to between 5 and 20 Mb depending upon resolution. It needed to be generated, encoded and compressed
Then it got uploaded, previewed and streamed/viewed n times. If it got viewed 1000 times, that’s 10 x 1000Mb =10 Gb of network bandwidth and storage. Client systems had to decompress, decode and render it…
In human terms:
Viewers spent 7 minutes each viewing it: 7000 minutes = 116 hours 40 minutes
If the viewers were smart and tech savvy, they had their AI summarise it first, so that required some more processing (but many would have got the gist from the summary and not gone on to view it, saving their time)The original text could probably have been read in <30 seconds, so wasted time was about 6500 minutes = 108 hours 20 minutes
I contend that the message could also have been distorted quite severely in this process!
Maybe we should just share the original prompt as a LinkedIn or similar post??
I propose a new metric, viz: Information Nutrition Quotient (INQ).
This is the useful information in a message (text, document, model, video) divided by the size of the message and the time/effort required from the receiver to process it (i.e. to successfully comprehend the message). Difficult to measure each of these factors, but the concept is still valuable. Try to encode the maximum useful information in the minimum bulk of message. Remember the ten commandments fit on two tablets, the US Constitution fits on four (large) pages and the entire syntax of Smalltalk on a postcard.